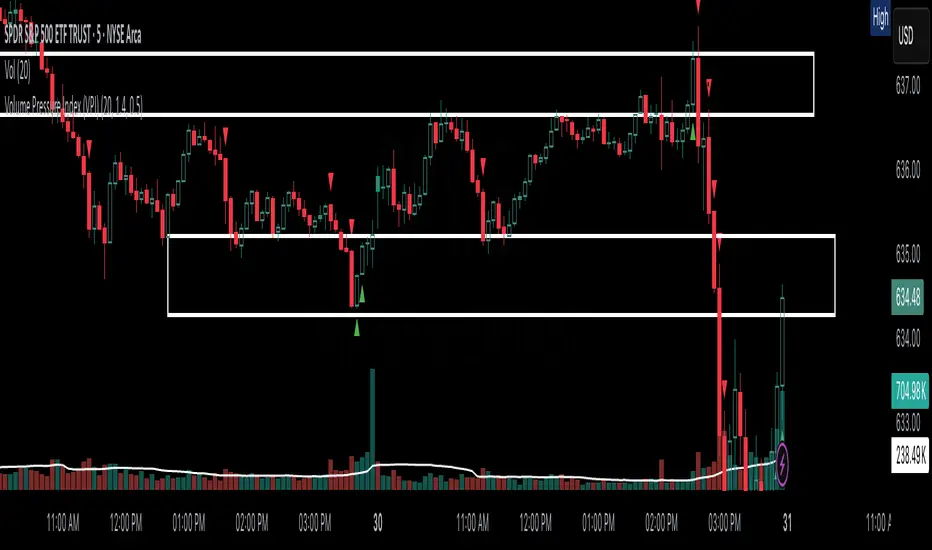
Volume Pressure Index (VPI)Volume Pressure Index Pro (VPI Pro) is a precision-tuned volume signal detector designed to isolate true buying/selling aggression and filter out noise.
It evaluates:
✅ Volume pressure surges (based on relative volume)
✅ Price action alignment (strong-bodied candles, no wicks)
✅ Trend context (EMA- or VWAP-based filtering)
✅ Candle positioning (e.g., closes near highs/lows to infer aggression)
✅ Zone-based confirmation (optional VWAP or custom levels)
Signals only trigger when multiple layers of confirmation align, minimizing false positives while preserving responsiveness to market pressure shifts.
⚙️ Core Components
VPI Calculation: Detects abnormal volume behavior tied to directional closes.
Aggression Estimator: Uses candle structure and location to infer pressure.
Relative Volume Spike Filter: Ensures only significant activity is considered.
Contextual Filters: Incorporates trend direction and location relative to key zones (EMA, VWAP, etc).
Visual Markers: Bullish and bearish pressure are clearly marked on chart.
In den Scripts nach "relative volume" suchen
Volatility & Market Regimes [AlgoXcalibur]Analyze Market Conditions Like a Pro.
Volatility & Market Regimes is a specialized, institution-inspired indicator designed to help traders instantly identify the current conditions of the market with clarity and confidence.
By combining a real-time Volatility Histogram and Strength Line with a compact Regime Table, this tool reveals four essential market dimensions—Volatility, Strength, Participation, and Noise—in a clean and intuitive format. Whether you’re confirming trade setups or managing risk, knowing the current regimes enhances awareness across all assets and timeframes.
🧠 Algorithm Logic
This sophisticated tool continuously monitors four independent regimes, each reflecting a distinct dimension of market behavior:
• Volatility – Gauges how active or dormant the market is by comparing current price action movement to historical averages. A dynamic, color-gradient Volatility Histogram transitions from Low (ice blue/white) to Medium (green/yellow) to High (orange/red), giving you an immediate assessment of volatility and risk.
• Strength – Measures directional intensity by assessing trend momentum, pressure, and persistence. A color-gradient Strength Line ranges from weak (red) to strong (green), helping traders determine if directional strength is trending, weakening, or consolidating.
• Participation – Analyzes relative volume to assess the level of trader engagement. Higher volume indicates stronger participation and conviction, while low volume may signal uncertainty, fading momentum, or even liquidity traps.
• Noise – Evaluates structural stability by measuring how orderly or chaotic the price action is. High noise suggests choppy, unstable conditions, while low noise reflects clean, stable moves.
Each regime includes a High / Medium / Low classification and a color-coded directional arrow to indicate whether condition parameters are increasing or decreasing. Together, these components deliver real-time market context—helping you stay grounded in logic, not emotion.
⚙️ User-Selectable Features
Each component of the indicator—the Volatility Histogram, Strength Line, and Regime Table—can be independently made visible or hidden to match your preference. This flexibility allows you to display only the Regime Table and move it directly to your main chart, where it auto-positions to the center-right and integrates seamlessly with other AlgoXcalibur indicators that also use data tables for a cohesive and refined experience.
📊 Clarity, Not Guesswork
Volatility & Market Regimes is a unique, institution-inspired algorithm rarely seen in retail trading. Not only does it clearly display volatility—it translates complex market behavior into a clear context to reveal what’s happening behind the candles. By decoding core regimes in real-time, this tool transforms uncertainty into structured insight—empowering traders to act with clarity, not guesswork.
🔐 To get access or learn more, visit the Author’s Instructions section.

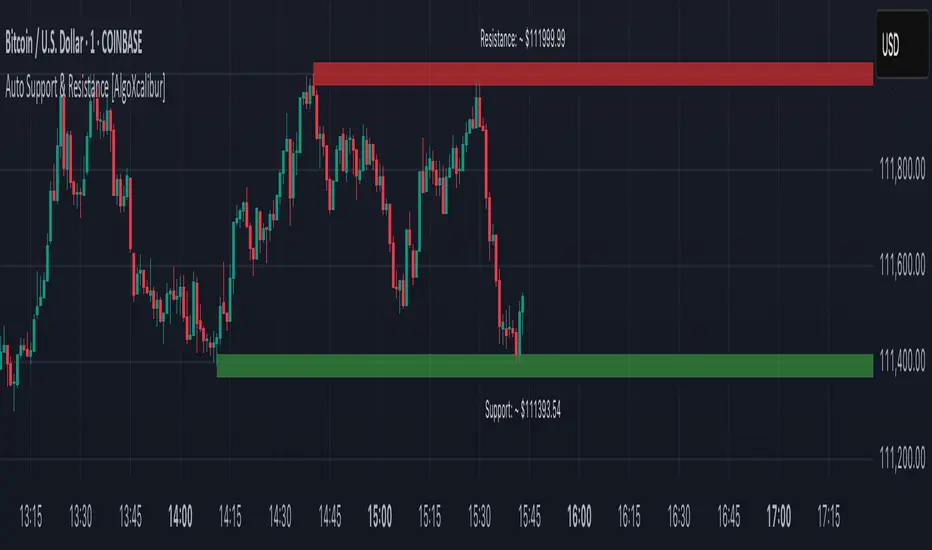
Auto Support & Resistance [AlgoXcalibur]Instantly visualize support and resistance levels with adaptive breakout prediction and zero chart clutter.
Combining reliable pivot level detection, relative volume, and price action confirmation, this tool delivers intelligent S/R zones that adapt to current market conditions. Whether you’re trading breakouts, navigating ranges, or using key levels to manage profits and risk — this indicator automatically identifies important levels for you, reducing your workload so you can better focus on your trades and decision-making.
🧠 Algorithm Logic
This ultra-refined Auto Support & Resistance indicator does more than just display reliable support and resistance levels — it applies a minimalist approach to display only the most relevant and actionable zones, while dynamically tracking their structural integrity in real time. The algorithm features unique Breakout Probability Detection — automatically switching lines from solid to dashed when volume and price action suggest a high probability that a breakout will occur. If a level is broken, the next relevant support or resistance level is immediately displayed on the chart, keeping the levels current and actionable so you do not miss critical insight. Optional Price Labels display the price of each level — practical if using these areas for setting take-profits or stop-losses. This algorithm keeps Support & Resistance what they are supposed to be — simple and useful — effortlessly providing a clean, adaptive view of evolving market structure.
⚙️ User-Selectable Features
• Breakout Probability Detection: When enabled, lines automatically switch from solid to dashed when volume and price action suggest a high breakout probability.
• Price Labels: When enabled, price labels display the price of the S/R for practical reference.
📊 Minimalistic Sophistication
Most automated support and resistance tools clutter the chart with dozens of static levels that do not react to price action. This tool displays only the single most relevant support and resistance level at a time, continuously monitoring for breaks and automatically updating when a level is invalidated. With breakout detection built in, it offers a modern, intuitive way to track structural integrity. This tool is designed to prioritize accuracy, adaptability, and visual simplicity — delivering a smart and refined tool for automatically identifying key levels with confidence.
🔐 To get access or learn more, visit the Author’s Instructions section.
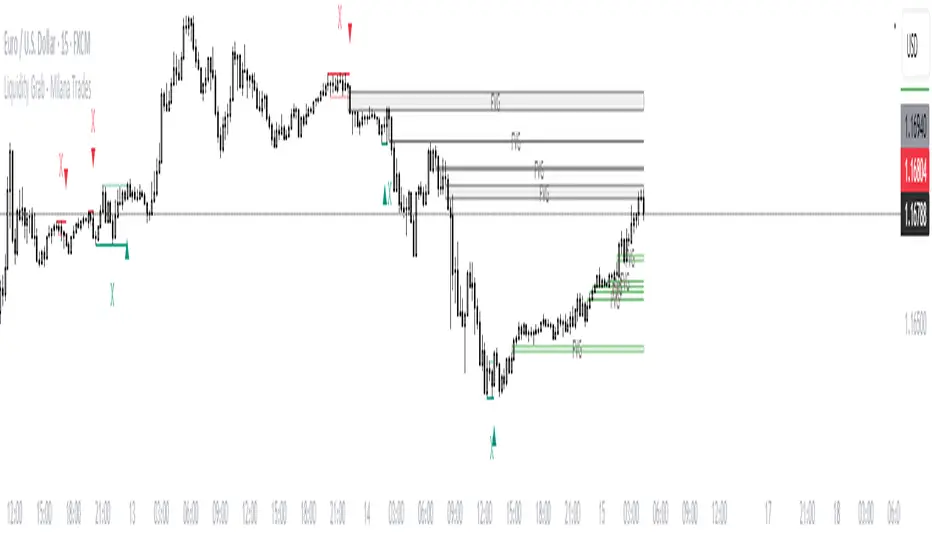
(ICT)Liquidity Grab + FVG + MSS/BOSThis script is a comprehensive educational indicator that combines and enhances several well-known trading concepts:
Liquidity Grabs (Swing Failure Patterns)
Fair Value Gaps (FVG)
Market Structure Shifts / Break of Structure (MSS/BOS)
Alerts
It identifies potential bullish and bearish liquidity grabs, confirms them optionally using volume validation on a lower timeframe, and tracks subsequent price structure changes. The indicator visually marks key swing highs/lows, FVG zones, and BOS/MSS levels—allowing traders to observe how price reacts to liquidity and imbalance zones.
🔍 Features:
Swing Failure Patterns (SFP):
Highlights possible liquidity grabs based on recent highs/lows and candle structure.
Volume Validation (Optional):
Filter signals using relative volume outside the swing on a lower timeframe. Adjustable threshold.
Fair Value Gaps (FVG):
Detects imbalance gaps and extends them for easy visualization.
Market Structure (MSS/BOS):
Displays Break of Structure (BOS) and Market Structure Shift (MSS) based on pivot highs/lows and closing conditions.
Dashboard:
A compact info panel displaying lower timeframe settings and validation status.
Custom Styling:
Adjustable colors, line styles, and label visibility for clean charting.
🧠 Ideal For:
Traders studying ICT concepts, smart money theories, and price-action-based strategies who want a visual tool for analysis and backtesting.
How to Use:
Wait for a Liquidity Grab (SFP) to form
The first condition for a potential entry is the formation of a Stop Hunt / Swing Failure Pattern (SFP).
This indicates that liquidity has been taken above or below a key level (e.g., previous high/low), and the market may be ready to reverse.
Confirmation with Fair Value Gap (FVG) and Market Structure Shift (MSS)
After the SFP, do not enter immediately. Wait for confirmation:
FVG : A Fair Value Gap (an imbalance in price action) must appear, signaling potential institutional activity.
MSS : A Market Structure Shift (break in the current trend) confirms a possible trend reversal or strong corrective move.
Enter the trade
Once both the FVG and MSS are confirmed after the SFP, you can safely enter a trade in the direction of the shift.
Alert Feature
The indicator includes an alert system to notify you when all conditions are met (SFP + FVG + MSS), so you can react quickly without constantly watching the chart.
Dr.Avinash Talele quarterly earnings, VCP and multibagger trakerDr. Avinash Talele Quarterly Earnings, VCP and Multibagger Tracker.
📊 Comprehensive Quarterly Analysis Tool for Multibagger Stock Discovery
This advanced Pine Script indicator provides a complete financial snapshot directly on your chart, designed to help traders and investors identify potential multibagger stocks and VCP (Volatility Contraction Pattern) setups with precision.
🎯 Key Features:
📈 8-Quarter Financial Data Display:
EPS (Earnings Per Share) - Track profitability trends
Sales Revenue - Monitor business growth
QoQ% (Quarter-over-Quarter Growth) - Spot acceleration/deceleration
ROE (Return on Equity) - Assess management efficiency
OPM (Operating Profit Margin) - Evaluate operational excellence
💰 Market Metrics:
Market Cap - Current company valuation
P/E Ratio - Valuation assessment
Free Float - Liquidity indicator
📊 Technical Positioning:
% Down from 52-Week High - Identify potential bottoming patterns
% Up from 52-Week Low - Track momentum from lows
Turnover Data (1D & 50D Average) - Volume analysis
ADR% (Average Daily Range) - Volatility measurement
Relative Volume% - Institutional interest indicator
🚀 How It Helps Find Multibaggers:
1. Growth Acceleration Detection:
Consistent EPS Growth: Identifies companies with accelerating earnings
Revenue Momentum: Tracks sales growth patterns quarter-over-quarter
Margin Expansion: Spots improving operational efficiency through OPM trends
2. VCP Pattern Recognition:
Volatility Contraction: ADR% helps identify tightening price ranges
Volume Analysis: Relative volume shows institutional accumulation
Distance from Highs: Tracks healthy pullbacks in uptrends
3. Fundamental Strength Validation:
ROE Trends: Ensures management is efficiently using shareholder capital
Debt-Free Growth: High ROE with growing margins indicates quality growth
Scalability: Revenue growth vs. margin expansion analysis
4. Entry Timing Optimization:
52-Week Positioning: Enter near lows, avoid near highs
Volume Confirmation: High relative volume confirms breakout potential
Valuation Check: P/E ratio helps avoid overvalued entries
💡 Multibagger Characteristics to Look For:
✅ Consistent 15-20%+ EPS growth across multiple quarters
✅ Accelerating revenue growth with QoQ% improvements
✅ ROE above 15% and expanding
✅ Operating margins improving over time
✅ Low debt (indicated by high ROE with growing profits)
✅ Strong cash generation (reflected in consistent growth metrics)
✅ 20-40% down from 52-week highs (ideal entry zones)
✅ Above-average volume during consolidation phases
🎨 Visual Design:
Clean white table with black borders for maximum readability
Color-coded QoQ% changes (Green = Growth, Red = Decline)
Centered positioning for easy chart analysis
8-quarter historical view for trend identification
📋 Perfect For:
Long-term investors seeking multibagger opportunities
Growth stock enthusiasts tracking earnings acceleration
VCP pattern traders looking for breakout candidates
Fundamental analysts requiring quick financial snapshots
Swing traders timing entries in growth stocks
⚡ Quick Setup:
Simply add the indicator to any NSE/BSE stock chart and instantly view comprehensive quarterly data. The table updates automatically with the latest financial information, making it perfect for screening and monitoring your watchlist.
🔍 Start identifying your next multibagger today with this powerful combination of fundamental analysis and technical positioning data!
Disclaimer: This indicator is for educational and analysis purposes. Always conduct thorough research and consider risk management before making investment decisions.

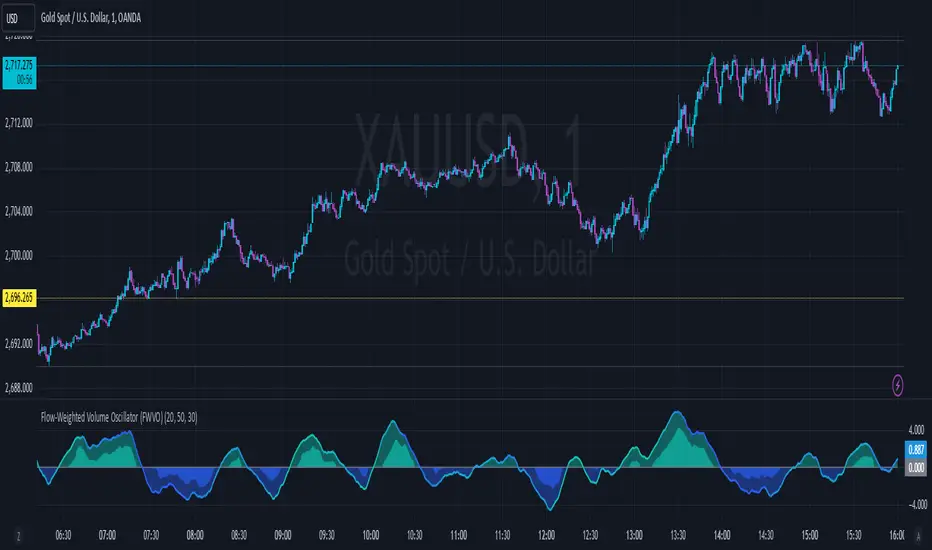
Flow-Weighted Volume Oscillator (FWVO)Volume Dynamics Oscillator (VDO)
Description
The Volume Dynamics Oscillator (VDO) is a powerful and innovative tool designed to analyze volume trends and provide traders with actionable insights into market dynamics. This indicator goes beyond simple volume analysis by incorporating a smoothed oscillator that visualizes the flow and momentum of trading activity, giving traders a clearer understanding of volume behavior over time.
What It Does
The VDO calculates the flow of volume by scaling raw volume data relative to its highest and lowest values over a user-defined period. This scaled volume is then smoothed using an exponential moving average (EMA) to eliminate noise and highlight significant trends. The oscillator dynamically shifts above or below a zero line, providing clear visual cues for bullish or bearish volume pressure.
Key features include:
Smoothed Oscillator: Displays the direction and momentum of volume using gradient colors.
Threshold Markers: Highlights overbought or oversold zones based on upper and lower bounds of the oscillator.
Visual Fill Zones: Uses color-filled areas to emphasize positive and negative volume flow, making it easy to interpret market sentiment.
How It Works
The calculation consists of several steps:
Smoothing with EMA: An EMA of the scaled volume is applied to reduce noise and enhance trends. A separate EMA period can be adjusted by the user (Volume EMA Period).
Dynamic Thresholds: The script determines upper and lower bounds around the smoothed oscillator, derived from its recent highest and lowest values. These thresholds indicate critical zones of volume momentum.
How to Use It
Bullish Signals: When the oscillator is above zero and green, it suggests strong buying pressure. A crossover from negative to positive can signal the start of an uptrend.
Bearish Signals: When the oscillator is below zero and blue, it indicates selling pressure. A crossover from positive to negative signals potential bearish momentum.
Overbought/Oversold Zones: Use the upper and lower threshold levels as indicators of extreme volume momentum. These can act as early warnings for trend reversals.
Traders can adjust the following inputs to customize the indicator:
High/Low Period: Defines the period for volume scaling.
Volume EMA Period: Adjusts the smoothing factor for the oscillator.
Smooth Factor: Controls the responsiveness of the smoothed oscillator.
Originality and Usefulness
The VDO stands out by combining dynamic volume scaling, EMA smoothing, and gradient-based visualization into a single, cohesive tool. Unlike traditional volume indicators, which often display raw or cumulative data, the VDO emphasizes relative volume strength and flow, making it particularly useful for spotting reversals, confirming trends, and identifying breakout opportunities.
The integration of color-coded fills and thresholds enhances usability, allowing traders to quickly interpret market conditions without requiring deep technical expertise.
Chart Recommendations
To maximize the effectiveness of the VDO, use it on a clean chart without additional indicators. The gradient coloring and filled zones make it self-explanatory, but traders can overlay basic trendlines or support/resistance levels for additional context.
For advanced users, the VDO can be paired with price action strategies, candlestick patterns, or other trend-following indicators to improve accuracy and timing.
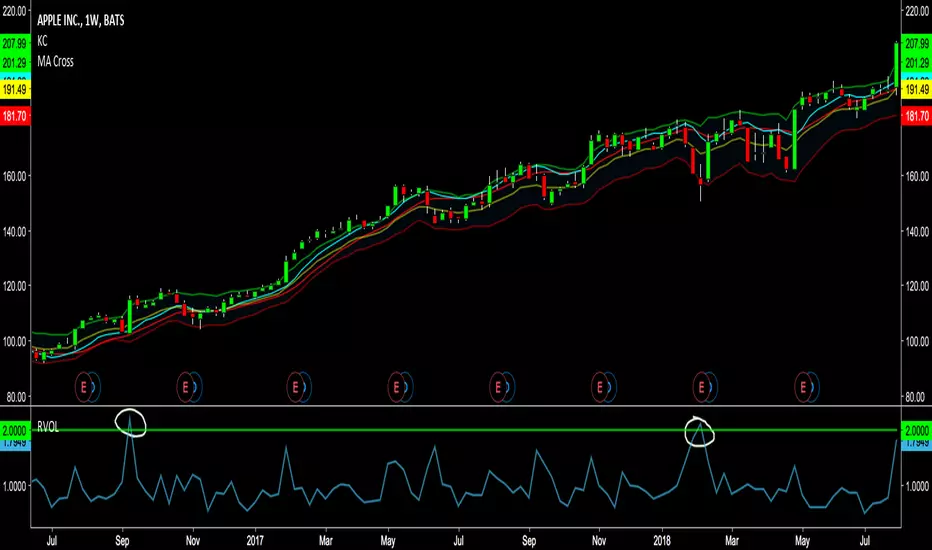
NVOL Normalized Volume & VolatilityOVERVIEW
Plots a normalized volume (or volatility) relative to a given bar's typical value across all charted sessions. The concept is similar to Relative Volume (RVOL) and Average True Range (ATR), but rather than using a moving average, this script uses bar data from previous sessions to more accurately separate what's normal from what's anomalous. Compatible on all timeframes and symbols.
Having volume and volatility processed within a single indicator not only allows you to toggle between the two for a consistent data display, it also allows you to measure how correlated they are. These measurements are available in the data table.
DATA & MATH
The core formula used to normalize each bar is:
( Value / Basis ) × Scale
Value
The current bar's volume or volatility (see INPUTS section). When set to volume, it's exactly what you would expect (the volume of the bar). When set to volatility, it's the bar's range (high - low).
Basis
A statistical threshold (Mean, Median, or Q3) plus a Sigma multiple (standard deviations). The default is set to the Mean + Sigma × 3 , which represents 99.7% of data in a normal distribution. The values are derived from the current bar's equivalent in other sessions. For example, if the current bar time is 9:30 AM, all previous 9:30 AM bars would be used to get the Mean and Sigma. Thus Mean + Sigma × 3 would represent the Normal Bar Vol at 9:30 AM.
Scale
Depends on the Normalize setting, where it is 1 when set to Ratio, and 100 when set to Percent. This simply determines the plot's scale (ie. 0 to 1 vs. 0 to 100).
INPUTS
While the default configuration is recommended for a majority of use cases (see BEST PRACTICES), settings should be adjusted so most of the Normalized Plot and Linear Regression are below the Signal Zone. Only the most extreme values should exceed this area.
Normalize
Allows you to specify what should be normalized (Volume or Volatility) and how it should be measured (as a Ratio or Percentage). This sets the value and scale in the core formula.
Basis
Specifies the statistical threshold (Mean, Median, or Q3) and how many standard deviations should be added to it (Sigma). This is the basis in the core formula.
Mean is the sum of values divided by the quantity of values. It's what most people think of when they say "average."
Median is the middle value, where 50% of the data will be lower and 50% will be higher.
Q3 is short for Third Quartile, where 75% of the data will be lower and 25% will be higher (think three quarters).
Sample
Determines the maximum sample size.
All Charted Bars is the default and recommended option, and ignores the adjacent lookback number.
Lookback is not recommended, but it is available for comparisons. It uses the adjacent lookback number and is likely to produce unreliable results outside a very specific context that is not suitable for most traders. Normalization is not a moving average. Unless you have a good reason to limit the sample size, do not use this option and instead use All Charted Bars .
Show Vol. name on plot
Overlays "VOLUME" or "VOLATILITY" on the plot (whichever you've selected).
Lin. Reg.
Polynomial regressions are great for capturing non-linear patterns in data. TradingView offers a "linear regression curve", which this script uses as a substitute. If you're unfamiliar with either term, think of this like a better moving average.
You're able to specify the color, length, and multiple (how much to amplify the value). The linear regression derives its value from the normalized values.
Norm. Val.
This is the color of the normalized value of the current bar (see DATA & MATH section). You're able to specify the default, within signal, and beyond signal colors. As well as the plot style.
Fade in colors between zero and the signal
Programmatically adjust the opacity of the primary plot color based on it's normalized value. When enabled, values equal to 0 will be fully transparent, become more opaque as they move away from 0, and be fully opaque at the signal. Adjusting opacity in this way helps make difference more obvious.
Plot relative to bar direction
If enabled, the normalized value will be multiplied by -1 when a bar's open is greater than the bar's close, mirroring price direction.
Technically volume and volatility are directionless. Meaning there's really no such thing as buy volume, sell volume, positive volatility, or negative volatility. There is just volume (1 buy = 1 sell = 1 volume) and volatility (high - low). Even so, visually reflecting the net effect of pricing pressure can still be useful. That's all this setting does.
Sig. Zone
Signal zones make identifying extremes easier. They do not signal if you should buy or sell, only that the current measurement is beyond what's normal. You are able to adjust the color and bounds of the zone.
Int. Levels
Interim levels can be useful when you want to visually bracket values into high / medium / low. These levels can have a value anywhere between 0 and 1. They will automatically be multiplied by 100 when the scale is set to Percent.
Zero Line
This setting allows you to specify the visibility of the zero line to best suit your trading style.
Volume & Volatility Stats
Displays a table of core values for both volume and volatility. Specifically the actual value, threshold (mean, median, or Q3), sigma (standard deviation), basis, normalized value, and linear regression.
Correlation Stats
Displays a table of correlation statistics for the current bar, as well as the data set average. Specifically the coefficient, R2, and P-Value.
Indices & Sample Size
Displays a table of mixed data. Specifically the current bar's index within the session, the current bar's index within the sample, and the sample size used to normalize the current bar's value.
BEST PRACTICES
NVOL can tell you what's normal for 9:30 AM. RVOL and ATR can only tell you if the current value is higher or lower than a moving average.
In a normal distribution (bell curve) 99.7% of data occurs within 3 standard deviations of the mean. This is why the default basis is set to "Mean, 3"; it includes the typical day-to-day fluctuations, better contextualizing what's actually normal, minimizing false positives.
This means a ratio value greater than 1 only occurs 0.3% of the time. A series of these values warrants your attention. Which is why the default signal zone is between 1 and 2. Ratios beyond 2 would be considered extreme with the default settings.
Inversely, ratio values less than 1 (the normal daily fluctuations) also tell a story. We should expect most values to occur around the middle 3rd, which is why interim levels default to 0.33 and 0.66, visually simplifying a given move's participation. These can be set to whatever you like and only serve as visual aids for your specific trading style.
It's worth noting that the linear regression oscillates when plotted directionally, which can help clarify short term move exhaustion and continuation. Akin to a relative strength index (RSI), it may be used to inform a trading decision, but it should not be the only factor.

ORB Heikin Ashi SPY 5min Correlation StrategyOverview:
The ORB (Opening Range Breakout) strategy combined with Heikin Ashi candles and Relative Volume (RVOL) indicator aims to capitalize on significant price movements that occur shortly after the market opens. This strategy identifies breakouts above or below the opening range, using Heikin Ashi candles for smoother price visualization and RVOL to gauge the strength of the breakout.
Components:
Opening Range Breakout (ORB): The strategy starts by defining the opening range, typically the first few minutes of the trading session. It then identifies breakouts above the high or below the low of this range as potential entry points.
Heikin Ashi Candles: Heikin Ashi candles are used to provide a smoother representation of price movements compared to traditional candlesticks. By averaging open, close, high, and low prices of the previous candle, Heikin Ashi candles reduce noise and highlight trends more effectively.
Relative Volume (RVOL): RVOL compares the current volume of a stock to its average volume over a specified period. It helps traders identify abnormal trading activity, which can signal potential price movements.
Candle for correlation : In this case we are using SPY candles. It can also use different asset
Strategy Execution:
Initialization: The strategy initializes by setting up variables and parameters, including the ORB period, session timings, and Heikin Ashi candle settings.
ORB Calculation: It calculates the opening range by identifying the high and low prices during the specified session time. These values serve as the initial reference points for potential breakouts. For this we are looking for the first 30 min of the US opening session.
After that we are going to use the next 2 hours to check for breakout opportunities.
Heikin Ashi Transformation: Optionally, the strategy transforms traditional candlestick data into Heikin Ashi format for smoother visualization and trend identification.
Breakout Identification: It continuously monitors price movements within the session and checks if the current high breaches the ORB high or if the current low breaches the ORB low. These events trigger potential long or short entry signals, respectively.
RVOL Analysis: Simultaneously, the strategy evaluates the relative volume of the asset to gauge the strength of the breakout. A surge in volume accompanying the breakout confirms the validity of the signal. In this case we are looking for at least a 1 value of the division between currentVolume and pastVolume
Entry and Exit Conditions: When a breakout occurs and is confirmed by RVOL and is within our session time, the strategy enters a long or short position accordingly. It does not have a stop loss or a takie profit level, instead it will always exit at the end of the trading session, 5 minutes before
Position Sizing and Commissions: For the purpose of this backtest, the strategy allocated 10% of the capital for each trade and assumes a trading commission of 0.01$ per share ( twice the IBKR broker values)
Session End: At the end of the trading session, the strategy closes all open positions to avoid overnight exposure.
Conclusion:
The combination of ORB breakout strategy, Heikin Ashi candles, and RVOL provides traders with a robust framework for identifying and capitalizing on early trends in the market. By leveraging these technical indicators together, traders can make more informed decisions and improve the overall performance of their trading strategies. However, like any trading strategy, it's essential to backtest thoroughly and adapt the strategy to different market conditions to ensure its effectiveness over time.

MultiWAPThe VWAP tracks the average price, giving weight to each candle based upon its' relative volume.
In other words, high-volume candles move the VWAP faster than low-volume candles.
On a good day, market maker:
-Buys the dip
-Pumps past resistance, causing bullish FOMO
-Sells into the bullish FOMO, causing bearish FOMO
-Buys the dip (rinse and repeat)
By default, MultiWAP begins at the first visible bar.
Range low/high - tracks the most recent high/low
Upper VWAP - tracks retail's average buy price (MM is selling)
Lower VWAP - tracks MM's average buy price (MM is buying)
If price closes below the lower VWAP or the range low, the lower VWAP and range low are reset.
If price closes above the upper VWAP or the range high, the upper VWAP and range high are reset.
Resets are indicated by the dots. Resetting either VWAP moves it close to last price, making it easy to breach again.
A down-trend that lasts many bars will produce a string of green dots. When the accumulation phase ends, price pulls away from the lower VWAP, so it stops resetting. The ABSENCE of green dots tells you that we're in the markup phase/up-trend.
An up-trend that lasts many bars will produce a string of red dots. When the distribution phase ends, price pulls away from the upper VWAP, so it stops resetting. The ABSENCE of red dots tells you that we're in the markdown phase/down-trend.
By default, the net result is two VWAP's that automatically anchor themselves to the most recent, significant, and visible, high and low.
Usage:
For any timeframe, I recommend starting zoomed way out. Find the last green dot and drop an "Anchored VWAP" there. Now, zoom in until that candle is no longer visible. Find the last green dot and drop an anchored VWAP there. Continue doing so until you notice the lower VWAP getting reset to basically the same place.
This works the same, in reverse, during down-trends.

Auto-magnifier / quantifytools- Overview
Auto-magnifier shows a lower timeframe view of candles and volume bars inside any main timeframe candle by zooming into it. Candles and volume bars as they develop are shown chronologically from left to right. By default, magnifier is triggered when less than 3 candles are visible on the chart.
By default, 20 lower timeframe candles are displayed by splitting main timeframe into 20 parts. The amount of candles displayed is a target rate, meaning the script will use a lower timeframe that has the closest match to 20 candles and therefore will vary a bit. Users can override automatic timeframe calculation and opt in to display any specific lower timeframe or adjust amount of candles shown (e.g. 20 -> 30 candles) per each main timeframe candle.
Example
Main timeframe set to 30 minute, candles displayed set to 20 -> Magnifying using 2 minute candles (30 minute/20 candles = 1.5 min, rounded to 2 min)
Main timeframe set to 30 minute, override set to 5 minutes -> Displaying 5 minute candles
Size of volume bars is calculated using relative volume (volume relative to volume SMA20), lowest bar representing relative volume values of under or equal to 1x the moving average and from there onwards progressively growing.
- Limitations and considerations
Amount of candles shown might flow over from the background on smaller screen sizes, in which case you would want to decrease the amount shown. Opposite is true for bigger screens, this value can be increased as more candles fit.
This indicator involves a lot of tricks with text elements to make it work automatically by zooming in. Size of wicks, bodies and volume bars are calculated by adding more text elements on big candles and less text elements on smaller candles. This means the displayed candles won't be a 100% match, but a rather a fair representation of the view, e.g. candle is green = lower timeframe candle is green, candle has a big wick = lower timeframe candle has a big wick (but not a 100% match).
Example
Magnified lower timeframe chart vs. Actual lower timeframe chart
Most mismatch will be found on the price levels where lower timeframe candles are shown, which is sacrificed for the sake of getting a better readability on the overall shape of lower timeframe price action. Users can alternatively optimize calculations for more accuracy, giving a better representation of the price levels where candles truly originated. This typically comes with the cost of worse readability however.
Example
Optimized for readability vs. Optimized for accuracy
- Visuals
All visual elements are fully customizable.

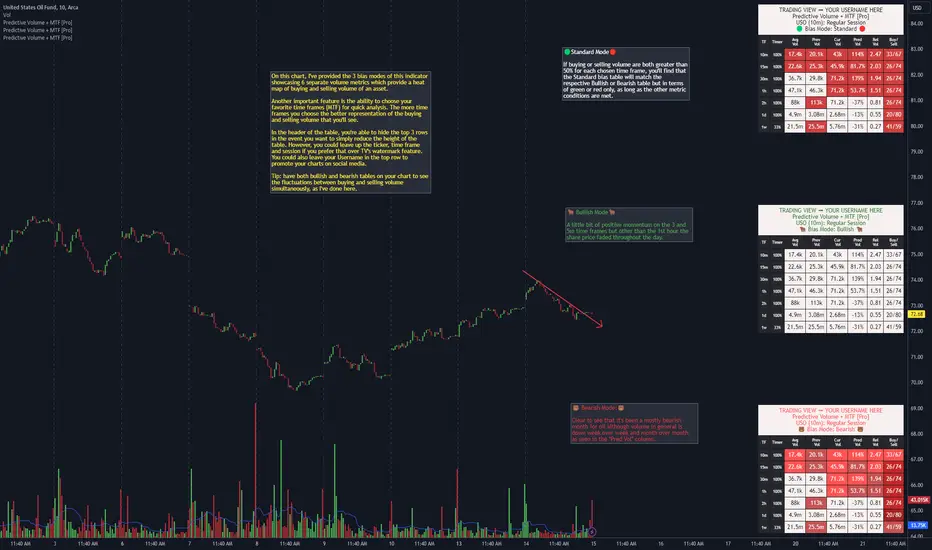
Predictive Volume + MTF [Pro]"Predictive Volume + MTF " is a predictor of near-future volume available on 13 of your favorite time frames. The script calculates the volume's % change (PredVol) between Current Volume vs. Previous Volume by predicting whether PredVol will be higher or lower at the end of the current bar using an "elapsed time" vs "volume so far" concept. This gives the benefit of the most up-to-date information without artificial low/high comparisons when a bar has just formed. For example, it would be common to see -100% in a lot of instances when a new bar is just forming which would be normal because volume at the start of a new candle will generally be lower than where it was when the last bar closed. Where this indicator shines is during this old to new bar formation relative to the volume that's carried over to the new bar. As a result, it will now be common to see PredVol values starting much higher because the calculation is dividing up the bar and analyzing fractions of it instead of the entire bar that would otherwise lead to these incorrect volume % change calculations.
Examples of Predictive Volume % Change:
In addition, this indicator uses many other advanced and robust features:
⚡ Matrices that create the table, allowing you to add and remove rows and columns to customize the table to show only the information that's important to you
⚡ View up to 13 time frames at once - it's generally a good idea to have at least 5 time frames up to get an overall feeling of the direction/sentiment of volume with the 1d being 1 of the 5
⏩ Includes the following popular time frames: 1m, 3m, 5m, 10m, 15m, 30m, 1h, 2h, 4h, 8h, 1d, week, month
⚡ 3 "bias mode" choices that use Relative Volume (RVOL) from calculations between Current, Previous & Average Volume that provide a heat map with varying degrees of color representing buying & selling momentum of your favorite asset. Traders generally have an innate bias when it comes to their trading methodology. The script's
author created separate modes to account for this. One way to utilize the indicator is to use 2 on your chart, 1 Bullish and 1 Bearish, to see if volume sentiment is skewed towards your particular bias
⏩ 🟢 Standard Mode 🔴 - displays green and red to depict volume momentum using same RVOL calculations as Bullish & Bearish modes
⏩ 🐂 Bullish Mode 🐂 - displays 5 colors to represent the levels of intensity of the Buy/Sell/RVOL data (light blue, green, yellow, light orange, dark orange)
⏩ 🐻 Bearish Mode 🐻 - displays 5 colors to represent the levels of intensity of the Buy/Sell/RVOL data (light red to dark red)
Ex. of all 3 bias modes showing very bullish volume sentiment:
Ex. of all 3 bias modes showing very bearish volume sentiment:
⚡ 2 types of alerts: PREDEFINED and CUSTOM
💡 PREDEFINED ALERTS consist of 4 Bullish & Bearish levels with Lvl 1 designed to be less sensitive than Lvl 2 etc
⏩ Configurable for every time frame, "On Close" or "Each Bar". On Close could be a better choice on lower time frames so that you're not getting a bunch of triggers over a short duration & Each Bar could be a better option for higher time frames so that you don't miss a move mid bar for instance
⏩ Creating a PREDEFINED BULLISH/BEARISH ALERT saves a snapshot of the alert's settings. You can then change the settings and create another alert
⏩ For example, you could create one alert for any alert type (bull and/or bear), for every time frame all at once, or you can create multiple & separate alerts, giving each one a unique name with the time frame that it's for: ex. BTC - Bullish Vol Lvl1 (1m) (keep in mind that TV provides you the ticker, time frame & alert
type automatically (the script's author hard-coded the label names within the script and as a result when they do fire you're provided the type of alert, such as "Bearish Vol (Lvl 1). Technically, you don't even need to name the alert again)
In this example, you're provided information on how to create PREDEFINED ALERTS, what conditions cause the alerts to trigger and how they'll look when they do fire
💡 CUSTOM ALERTS consists of 6 metrics giving you the ability to create your own custom compound alerts
⏩ Configurable for every time frame, "On Close" or "Each Bar". On Close could be a better choice on lower time frames so that you're not getting a bunch of triggers over a short duration & Each Bar could be a better option for higher time frames so that you don't miss a move mid bar for instance
⏩ Creating a CUSTOM ALERT works the same way as PREDEFINED ALERTS (see chart below)
⏩ Check your conditions in real-time for accuracy via a debug feature aka "SHOW HELP FOR TIME FRAME"
In this example, you're provided information on how to create CUSTOM ALERTS
⚡ Header function that provides the ticker, time frame and session that you're on (can use in lieu of TV's watermark feature, or use together)
⏩ There's 2 customizable header inputs - you could include your TradingView username in one of them for the times when promoting your charts across your favorite social media sites
⚡ Timer that shows you when a bar will begin/end plus other features that allow you to change the size and positioning of the table within your charts
⚡ An input that allows you to change the "significant figures" for rounding purposes - can be especially useful when volume is low or when you're trading OTC stocks
⚡ 4 volume moving average lengths - Intraday, Daily, Weekly, Monthly - for those times when 1 moving average to cover the entire gamut of just won't suffice
////////////////////////////////
There's quite a bit more information provided in the attached charts as well as the tooltips within the inputs section of the indicator. Should you have any questions, feedback etc, please do not hesitate to contact the script's author. My hope is that this indicator becomes an invaluable resource to you and you're able to integrate it in to your everyday trading tool bag to make more informed decisions.
peacefulIndicatorsWe are delighted to present the PeacefulIndicators library, a modest yet powerful collection of custom technical indicators created to enhance your trading analysis. The library features an array of practical tools, including MACD with Dynamic Length, Stochastic RSI with ATR Stop Loss, Bollinger Bands with RSI Divergence, and more.
The PeacefulIndicators library offers the following functions:
macdDynamicLength: An adaptive version of the classic MACD indicator, which adjusts the lengths of the moving averages based on the dominant cycle period, providing a more responsive signal.
rsiDivergence: A unique implementation of RSI Divergence detection that identifies potential bullish and bearish divergences using a combination of RSI and linear regression.
trendReversalDetection: A helpful tool for detecting trend reversals using the Rate of Change (ROC) and Moving Averages, offering valuable insights into possible market shifts.
volume_flow_oscillator: A custom oscillator that combines price movement strength and volume to provide a unique perspective on market dynamics.
weighted_volatility_oscillator: Another custom oscillator that factors in price volatility and volume to deliver a comprehensive view of market fluctuations.
rvo: The Relative Volume Oscillator highlights changes in volume relative to historical averages, helping to identify potential breakouts or reversals.
acb: The Adaptive Channel Breakout indicator combines a moving average with an adjustable volatility multiplier to create dynamic channels, useful for identifying potential trend shifts.
We hope this library proves to be a valuable addition to your trading toolbox.
Library "peacefulIndicators"
A custom library of technical indicators for trading analysis, including MACD with Dynamic Length, Stochastic RSI with ATR Stop Loss, Bollinger Bands with RSI Divergence, and more.
macdDynamicLength(src, shortLen, longLen, signalLen, dynLow, dynHigh)
Moving Average Convergence Divergence with Dynamic Length
Parameters:
src (float) : Series to use
shortLen (int) : Shorter moving average length
longLen (int) : Longer moving average length
signalLen (int) : Signal line length
dynLow (int) : Lower bound for the dynamic length
dynHigh (int) : Upper bound for the dynamic length
Returns: tuple of MACD line and Signal line
Computes MACD using lengths adapted based on the dominant cycle period
rsiDivergence(src, rsiLen, divThreshold, linRegLength)
RSI Divergence Detection
Parameters:
src (float) : Series to use
rsiLen (simple int) : Length for RSI calculation
divThreshold (float) : Divergence threshold for RSI
linRegLength (int) : Length for linear regression calculation
Returns: tuple of RSI Divergence (positive, negative)
Computes RSI Divergence detection that identifies bullish (positive) and bearish (negative) divergences
trendReversalDetection(src, rocLength, maLength, maType)
Trend Reversal Detection (TRD)
Parameters:
src (float) : Series to use
rocLength (int) : Length for Rate of Change calculation
maLength (int) : Length for Moving Average calculation
maType (string) : Type of Moving Average to use (default: "sma")
Returns: A tuple containing trend reversal direction and the reversal point
Detects trend reversals using the Rate of Change (ROC) and Moving Averages.
volume_flow_oscillator(src, length)
Volume Flow Oscillator
Parameters:
src (float) : Series to use
length (int) : Period for the calculation
Returns: Custom Oscillator value
Computes the custom oscillator based on price movement strength and volume
weighted_volatility_oscillator(src, length)
Weighted Volatility Oscillator
Parameters:
src (float) : Series to use
length (int) : Period for the calculation
Returns: Custom Oscillator value
Computes the custom oscillator based on price volatility and volume
rvo(length)
Relative Volume Oscillator
Parameters:
length (int) : Period for the calculation
Returns: Custom Oscillator value
Computes the custom oscillator based on relative volume
acb(price_series, ma_length, vol_length, multiplier)
Adaptive Channel Breakout
Parameters:
price_series (float) : Price series to use
ma_length (int) : Period for the moving average calculation
vol_length (int) : Period for the volatility calculation
multiplier (float) : Multiplier for the volatility
Returns: Tuple containing the ACB upper and lower values and the trend direction (1 for uptrend, -1 for downtrend)

Fair value bands / quantifytools— Overview
Fair value bands, like other band tools, depict dynamic points in price where price behaviour is normal or abnormal, i.e. trading at/around mean (price at fair value) or deviating from mean (price outside fair value). Unlike constantly readjusting standard deviation based bands, fair value bands are designed to be smooth and constant, based on typical historical deviations. The script calculates pivots that take place above/below fair value basis and forms median deviation bands based on this information. These points are then multiplied up to 3, representing more extreme deviations.
By default, the script uses OHLC4 and SMA 20 as basis for the bands. Users can form their preferred fair value basis using following options:
Price source
- Standard OHLC values
- HL2 (High + low / 2)
- OHLC4 (Open + high + low + close / 4)
- HLC3 (High + low + close / 3)
- HLCC4 (High + low + close + close / 4)
Smoothing
- SMA
- EMA
- HMA
- RMA
- WMA
- VWMA
- Median
Once fair value basis is established, some additional customization options can be employed:
Trend mode
Direction based
Cross based
Trend modes affect fair value basis color that indicates trend direction. Direction based trend considers only the direction of the defined fair value basis, i.e. pointing up is considered an uptrend, vice versa for downtrend. Cross based trends activate when selected source (same options as price source) crosses fair value basis. These sources can be set individually for uptrend/downtrend cross conditions. By default, the script uses cross based trend mode with low and high as sources.
Cross based (downtrend not triggered) vs. direction based (downtrend triggered):
Threshold band
Threshold band is calculated using typical deviations when price is trading at fair value basis. In other words, a little bit of "wiggle room" is added around the mean based on expected deviation. This feature is useful for cross based trends, as it allows filtering insignificant crosses that are more likely just noise. By default, threshold band is calculated based on 1x median deviation from mean. Users can increase/decrease threshold band width via input menu for more/less noise filtering, e.g. 2x threshold band width would require price to cross wiggle room that is 2x wider than typical, 0x erases threshold band altogether.
Deviation bands
Width of deviation bands by default is based on 1x median deviations and can be increased/decreased in a similar manner to threshold bands.
Each combination of customization options produces varying behaviour in the bands. To measure the behaviour and finding fairest representation of fair and unfair value, some data is gathered.
— Fair value metrics
Space between each band is considered a lot, named +3, +2, +1, -1, -2, -3. For each lot, time spent and volume relative to volume moving average (SMA 20) is recorded each time price is trading in a given lot:
Depending on the asset, timeframe and chosen fair value basis, shape of the distributions vary. However, practically always time is distributed in a normal bell curve shape, being highest at lots +1 to -1, gradually decreasing the further price is from the mean. This is hardly surprising, but it allows accurately determining dynamic areas of normal and abnormal price behaviour (i.e. low risk area between +1 and -1, high risk area between +-2 to +-3). Volume on the other hand is typically distributed the other way around, being lowest at lots +1 to -1 and highest at +-2 to +-3. When time and volume are distributed like so, we can conclude that 1) price being outside fair value is a rare event and 2) the more price is outside fair value, the more anomaly behaviour in volume we tend to find.
Viewing metric calculations
Metric calculation highlights can be enabled from the input menu, resulting in a lot based coloring and visibility of each lot counter (time, cumulative relative volume and average relative volume) in data window:
— Alerts
Available alerts are the following:
Individual
- High crossing deviation band (bands +1 to +3 )
- Low crossing deviation band (bands -1 to -3 )
- Low at threshold band in an uptrend
- High at threshold band in a downtrend
- New uptrend
- New downtrend
Grouped
- New uptrend or downtrend
- Deviation band cross (+1 or -1)
- Deviation band cross (+2 or -2)
- Deviation band cross (+3 or -3)
— Practical guide
Example #1 : Risk on/risk off trend following
Ideal trend stays inside fair value and provides sufficient cool offs between the moves. When this is the case, fair value bands can be used for sensible entry/exit levels within the trend.
Example #2 : Mean reversions
When price shows exuberance into an extreme deviation, followed by a stall and signs of exhaustion (wicks), an opportunity for mean reversion emerges. The higher the deviation, the more volatility in the move, the more signalling of exhaustion, the better.
Example #3 : Tweaking bands for desired behaviour
The faster the length of fair value basis, the more momentum price needs to hit extreme deviation levels, as bands too are moving faster alongside price. Decreasing fair value basis length typically leads to more quick and aggressive deviations and less steady trends outside fair value.

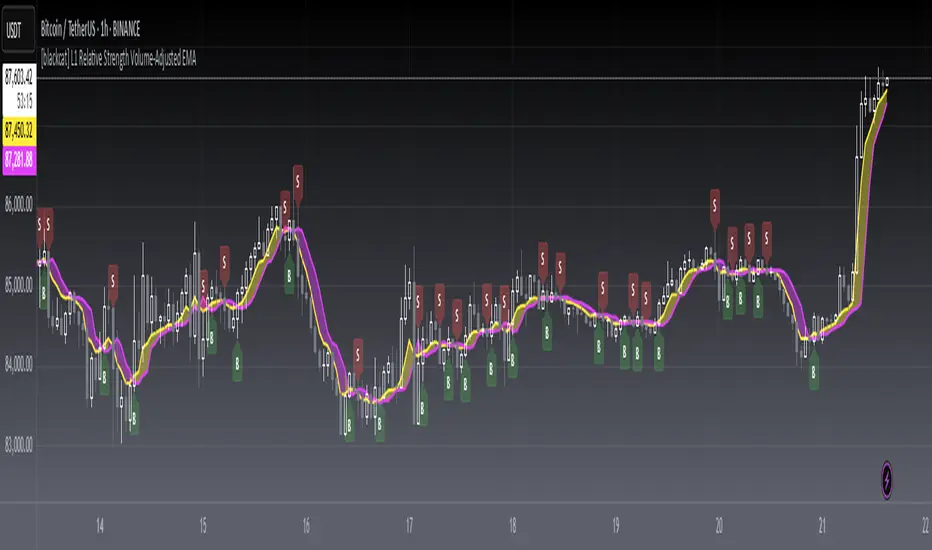
[blackcat] L1 Relative Strength Volume-Adjusted EMALevel 1
Background
Vitali Apirine proposed an idea of “Relative Strength Moving Averages, Part 2 (RS VA EMA)” on October 2022.
Function
Based on my understanding, Vitali combines the merits of RSI, volume and EMA to improve moving average performance. It takes the relative volume strength into account and includes a measurement between positive and negative volume flow in the calculation, which gives direction to the volume input. In details, volume is considered positive when the close is higher than the previous close and negative when the close is lower than the previous close. I used 2 period lagged signal as trigger so that the pair fast and slow lines can form golden cross and dead cross where entry signal can be produced.
Remarks
Feedbacks are appreciated.
Daily Volume, RVol, RRVol, and RS/RW LabelsHeads-up display of essential Real Day Trading criteria
Daily Volume
Relative Strength/Weakness
ATR 14 and ATR 14 percent of price
Relative Volume (RVol)
Relative Volume to SPY RVol (RRVol)

Market First - Relative Strength/Weakness (the ZenBot strategy)This market-first trading strategy gives BUY, SHORT, and CLOSE signals based on volume, trend, and relative strength or weakness to the market (SPY by default, can be customized). This indicator is useful for signaling day-trade entries and exits for tickers that are strong (or weak) against the market.
Stocks that are showing relative strength (or weakness) to the market, are trending, and have decent movement generate a buy (or short) signal. When the trend runs out, a CLOSE signal is fired.
Potential profit (based on ATR) and actual profit is calculated, predicting the type of move expected
Unique 'stay in trade' logic helps prevent unnecessary CLOSE signals if a trend is likely to continue
A colored plot indicates the strength of the current trend and turns orange/red when the strength is weakened.
Crypto traders can uncheck 'Trade during market hours' for 24-hour trading, and should change the comparison ticker from SPY to BTCUSD or something similar for their market.
Enjoy!
KEY CONCEPTS
The three- and five-minute timeframes are used to establish and verify trend ( ADX /DI with custom logic)
Entries and exits are based on Parabolic SAR and confirmed on multiple timeframes, trend, and relative volume
Relative strength /weakness to the market compares ticker to SPY
Chop is avoided at all costs. I've experimented with choppiness indicator below 38, but found that the ADX DI+/- readings work even better.
Trend is established using ADX DI+/- readings over 20, confirmed by EMA 5/13 crossover and EMA5 slope
Signals will fire only if the average volume for the current 5-min bar is above normal
Only tickers with a five-bar / 13 period ATR of 1% the ticker's price generate signal.
Only longs above daily-anchored VWAP , shorts below daily-anchored VWAP
Signals fire on bar close to prevent repainting / look-ahead bias
Indicator labels and alerts generated
SIGNALS
BUY: up-trending tickers showing relative strength are bought on the three-minute PSAR
SELL: when the close price falls below the 1, 3, and 5-minute PSAR, or the ADX DI- falls below 20
SHORT: down-trending tickers with relative weakness are shorted on the three-minute PSAR
COVER: when the close price moves above the 1, 3, and 5-minute PSAR, or the ADX DI- falls below 20
ALERTS
Alerts are generated on BUY, SELL, SHORT, and COVER signals, as well as optional LOST RELATIVE STRENGTH and LOST RELATIVE WEAKNESS
INPUTS
Use relative strength /weakness comparison with the market : trigger trades based on the ticker's strength or weakness to the selected comparison ticker (usually SPY for equities or BTCUSD for crypto)
[* ]Comparison Ticker for relative strength /weakness : Ticker to compare against for relative strength /weakness
Trade during market hours only : Take buy/sells during specified hours. Disable this for crypto trading.
[* ]Market hours (market time) : Customize market hours - defaults to 9:30 to 16:00 EST
[* ]"Only trade very strong trends" : take trades only if an established trend is very strong ( ADX over 40 ) (DEFAULT = ON)
"Limit trade direction to VWAP" : Long trades only above VWAP , shorts below (DEFAULT = ON)
"Limit trade direction to Market direction" : Long trades only if SPY (or selected comparison ticker) is up, shorts if the market is down. (DEFAULT= ON)
"Limit trades based on a ticker's green/red status for the day" : Long trades if the ticker is green for the day, shorts if red. (DEFAULT = ON)

Market First Signals - Relative Strength/WeaknessThis market-first trading strategy gives BUY, SHORT, and CLOSE signals based on volume, trend, and relative strength or weakness to the market (SPY by default, can be customized). This indicator is useful for signaling day-trade entries and exits for tickers that are strong (or weak) against the market.
Stocks that are showing relative strength (or weakness) to the market, are trending, and have decent movement generate a buy (or short) signal. When the trend runs out, a CLOSE signal is fired.
Potential profit (based on ATR) and actual profit is calculated, predicting the type of move expected
Unique 'stay in trade' logic helps prevent unnecessary CLOSE signals if a trend is likely to continue
A colored plot indicates the strength of the current trend and turns orange/red when the strength is weakened.
Crypto traders can uncheck 'Trade during market hours' for 24-hour trading, and should change the comparison ticker from SPY to BTCUSD or something similar for their market.
Enjoy!
KEY CONCEPTS
The three- and five-minute timeframes are used to establish and verify trend (ADX/DI with custom logic)
Entries and exits are based on Parabolic SAR and confirmed on multiple timeframes, trend, and relative volume
Relative strength /weakness to the market compares ticker to SPY
Chop is avoided at all costs. I've experimented with choppiness indicator below 38, but found that the ADX DI+/- readings work even better.
Trend is established using ADX DI+/- readings over 20, confirmed by EMA 5/13 crossover and EMA5 slope
Signals will fire only if the average volume for the current 5-min bar is above normal
Only tickers with a five-bar / 13 period ATR of 1% the ticker's price generate signal.
Only longs above daily-anchored VWAP, shorts below daily-anchored VWAP
Signals fire on bar close to prevent repainting / look-ahead bias
Indicator labels and alerts generated
SIGNALS
BUY: up-trending tickers showing relative strength are bought on the three-minute PSAR
SELL: when the close price falls below the 1, 3, and 5-minute PSAR, or the ADX DI- falls below 20
SHORT: down-trending tickers with relative weakness are shorted on the three-minute PSAR
COVER: when the close price moves above the 1, 3, and 5-minute PSAR, or the ADX DI- falls below 20
ALERTS
Alerts are generated on BUY, SELL, SHORT, and COVER signals, as well as optional LOST RELATIVE STRENGTH and LOST RELATIVE WEAKNESS
INPUTS
Use relative strength/weakness comparison with the market : trigger trades based on the ticker's strength or weakness to the selected comparison ticker (usually SPY for equities or BTCUSD for crypto)
Comparison Ticker for relative strength/weakness : Ticker to compare against for relative strength/weakness
Trade during market hours only : Take buy/sells during specified hours. Disable this for crypto trading.
Market hours (market time) : Customize market hours - defaults to 9:30 to 16:00 EST
"Only trade very strong trends" : take trades only if an established trend is very strong (ADX over 40) (DEFAULT = OFF)
"Limit trade direction to VWAP" : Long trades only above VWAP, shorts below (DEFAULT = ON)
"Limit trade direction to Market direction" : Long trades only if SPY (or selected comparison ticker) is up, shorts if the market is down. (DEFAULT= OFF)
"Limit trades based on a ticker's green/red status for the day" : Long trades if the ticker is green for the day, shorts if red. (DEFAULT = OFF)

The Red PillThis indicator identifies the following signals: Pivots, Ranges and EMA's, Initial Balance, Open, Previous Day Close, volume and Relative Volume. When there are many signals at the same time a label will appear indicating that this is an area of interest. This does not suggest any trade suggestions / direction, nor is it trading advice. It only helps you see convergence of multiple signals.
Here is an example

RSI true swingsRelative Strength Index (RSI) is being used by majority of the traders to get benefitted based on the swings. But these swings are hard to Identify.
This Indicator uses 4 major factors for finding the potential reversal points:
RSI Crossover or crossunder
Relative volume
Overall volume against the moving average volume
Relative closing of the candles
Size of the bars
Please read Instructions carefully before using this indicator
Recommended entry is the OHLC4 of the signal bars.
If signal bar is too large, try to enter in the retracement when another signal comes either through indicator or through types of bars
when signals comes opposite to the trend, then try to wait for the next signal of same type. This creates a RSI-price divergence in confirmation by volume price action
Timeframe can be of your choice
Recommended stoploss should be swing highs or lows

Relative VolatilityRelative volatility highlights large changes in price. This was designed to be used with my relative volume indicator so that traders can see the effect of volume on price action. It is also a good tool to analyse breakout patterns to identify best entry points and waves.
Above shows relative volatility and relative volume working together.

ETH Spot Volume DominanceSimple Indicator that shows you the relative volume ratio between ETH spot markets and derivatives markets.
The higher the ratio the more dominant spot markets are (which is generally considered bullish).
Markets included for spot:
Coinbase USD
Bitstamp USD
Bitfinex USD
Kraken USD
Binance USDT
Huobi USDT
Okex USDT
Poloniex USDT
Markets included for derivatives (only perps of course):
Binance USDT
Huobi USD
Okex USD
Bybit USD
Bitmex USD
FTX USD
Deribit USD
Kraken USD
This is free so just add it to your favourites.
Enjoy.

RVOL - Relative VolumeSee how much "in play" a stock is, filter the noise and take action on the big volume spikes.